|
|
|
|
|
OR&A™ Solution
Features
Project Summary Screen
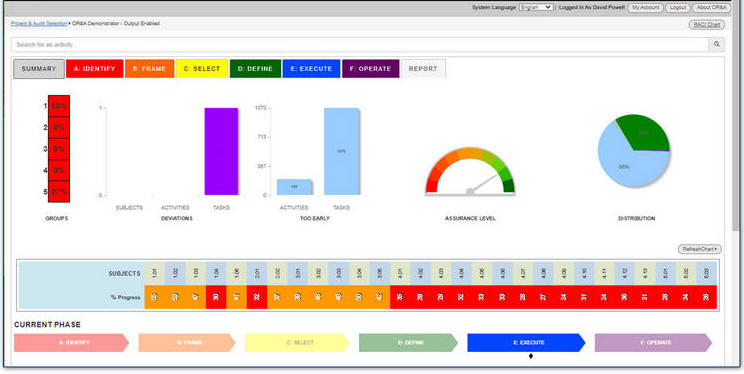
and Wave Chart This central area of this screen is made up of a number of 'widgets' which can be displayed, hidden or re-arranged to suit the requirements of a particular project or client. The illustration below shows a typical layout of this screen. All of the text labels and colours used on this screen can be modified to a client requirements as part of the user template setup.
OR&A Project Summary Screen The information provided on the Project Summary screen is a high-level overview of the current status of the project in respect of implementation of the OR&A™ process and progression towards 'Ready to Operate' status.
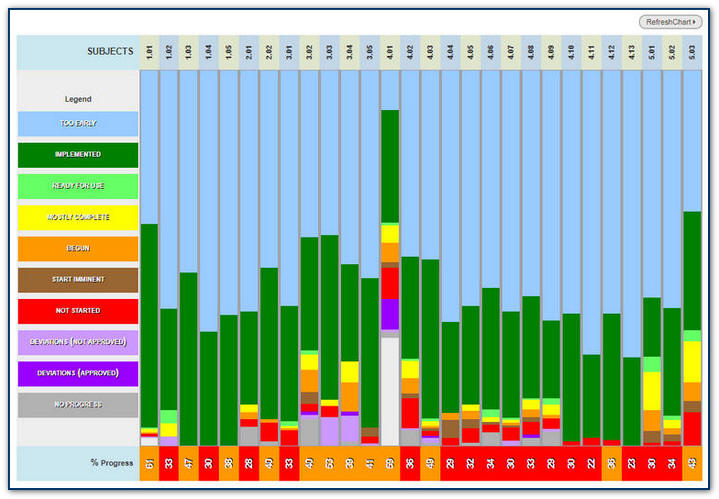
Project Wave Chart
OR&A Project Summary Screen The 'Wave Chart' displays the current 'real-time' status of every task in the OR&A™ Process. The chart is interactive and is used to identify and diagnose issues or oversights within the process. |

|
© OR&A™ |